11.2 Control camera
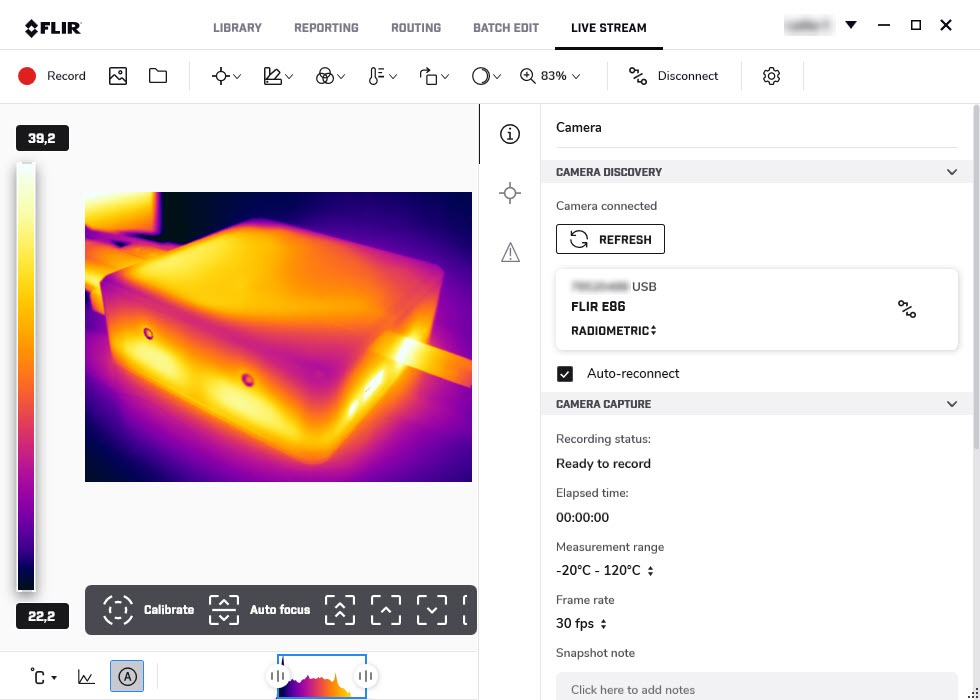
When the camera is connected, you can record radiometric video, save snapshots, calibrate the camera, and adjust the camera focus. There are also functions similar to the ones in the image editor, such as measurement tools, isotherm controls, and temperature scale adjustment.

Acoustic videos and images
This chapter describes how to view, edit, and create reports based on acoustic videos and images from the FLIR Si124 camera.
Note The acoustic functionality is available as a plug-in for FLIR Thermal Studio Pro. For information on how to activate the Acoustic plug-in, see 3.4 Plug-in activation .
12.1 FLIR Si124
FLIR Si124 is an acoustic camera that uses 124 microphones to form an acoustic image on top of a digital camera picture. The FLIR Si124 can be used for localization and classification of high-voltage partial discharges and for localization of pressurized air leaks.
The acoustic video and image files from the FLIR Si124 camera have the extension .nlz.
For more information, refer to the FLIR Si124 user manual.
12.2 View and edit videos and images
You can open the acoustic video and image files (.nlz) using FLIR Thermal Studio.
On the Library tab, you can view your acoustic videos and images . When you click an acoustic file in the center pane, the analysis results and other information are shown in the pane to the right. For videos, the displayed results and information relate to the last frame in the video recording.
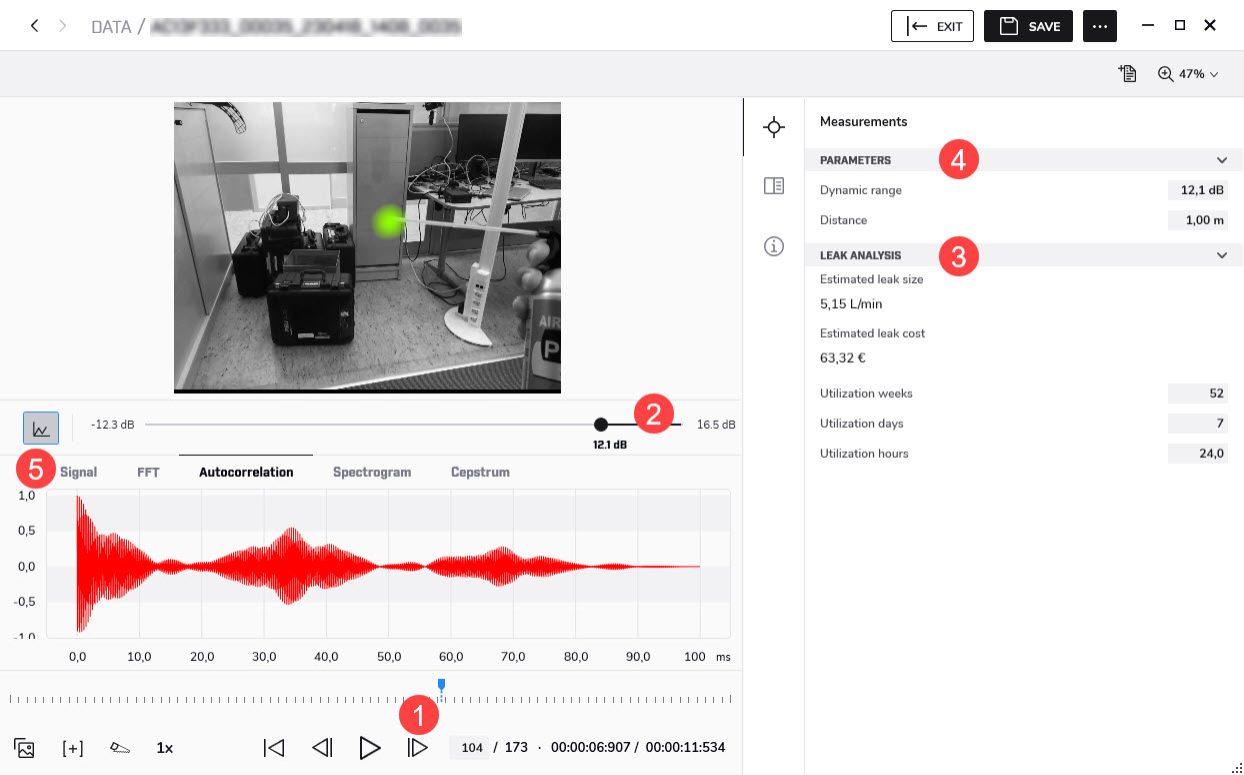
To edit a video or image, double-click the file or click Edit image in the right pane. This opens the image editor. This image shows what the image editor looks like when you have selected an acoustic video.

Use the controls to play/pause/stop the video recording and to select a specific frame in the video recording. Note that the analysis results in the right pane relate to the currently displayed frame.
By changing the dynamic range, you can analyze the snapshot in more detail – you can decrease the range to get the precise location of the strongest sound source, and increase it to see if there are multiple sound sources. To change the dynamic range, use the slider under the image or enter the level in the Dynamic range field in the pane to the right.
Depending on the mode selected in the camera when taking the picture, leak analysis results or partial discharge analysis results will be shown. For more information, see sections 12.2.1 Leak analysis and 12.2.2 Partial discharge analysis .
The analysis results depend on the Parameters settings. The leak analysis results also depend on the leak analysis settings, see section 12.2.1.1 Leak analysis settings .
The sound signal from the dominant source in the image can be visualized in different ways:
12.2.1 Leak analysis
For a compressed air leak, the Estimated leak size and Estimated annual cost are displayed, as well as utilization data.
The leak analysis results depend on the distance and leak analysis settings.
12.2.1.1 Leak analysis settings
Settings related to leak analysis are available on the Plugins tab on the Settings window, see section 4.2 Settings .
The currency in which to display the leak cost estimate.
The unit used to display the leak size estimate. Available options are: l/min (liters per minute) and Cf/min (cubic feet per minute).
To estimate the cost of compressed air leaks, the energy cost must be known. Typically this means the local price (per kWh) of electricity. Note that if the currency is changed, the energy cost must be updated accordingly.
The leak size estimation in the FLIR Si124 has been developed based on a large set of different measured leaks. It might, however, in some cases underestimate the leak size, or in other cases overestimate the leak size, since the leak size depends on a large amount of different variables. If the leak size estimate systematically differs from your own observations, you can adjust it by setting the leak size correction factor. A leak correction less than 1.0 will produce smaller estimates, while a leak correction larger than 1.0 will produce larger estimates.
12.2.2 Partial discharge analysis
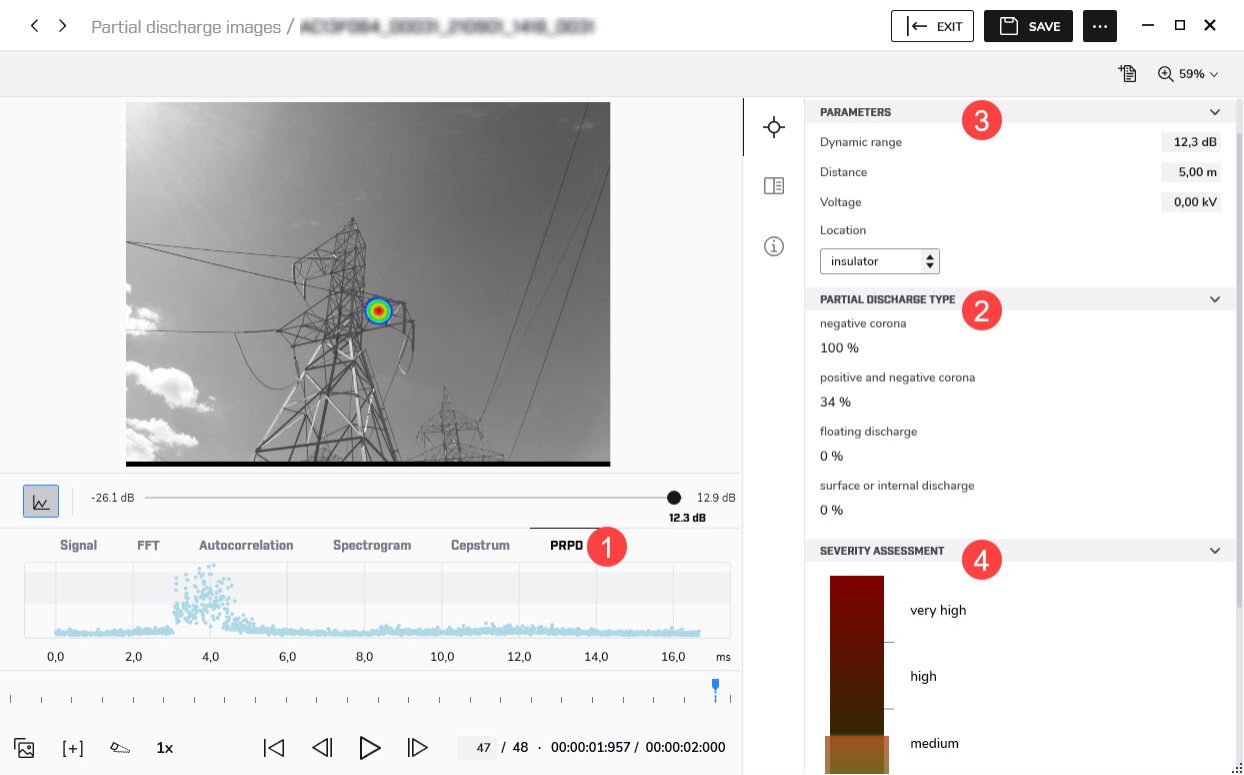
This image shows what the image editor looks like when an image is recognized as a possible partial discharge.

The PRPD (Phase Resolved Partial Discharge) pattern is used for analyzing the PD type – different PD types typically have a distinct pattern.
There are four categories:
The percentage indicates how certain the system is that the detected PD is of a specific type. Several categories may have approximately the same percentage, which means that the system is uncertain as to which type it is.
The sound attenuates over distance, which needs to be considered. A very precise Distance is not a requirement for the severity assessment but may produce more accurate results.
The Voltage and Location affect the severity assessment and recommended actions.
The colored bar, ranging from green, yellow, and orange to red, shows the severity assessment. The highlighted region indicates the estimated severity range of the detected partial discharge.
The more the parameters (distance, voltage, and location) are specified, the more precise the severity assessment will typically be.
There is a description of the type of partial discharge and a recommendation for the actions to be taken.
Note The severity assessment only provides general guidelines based on the likely type of PD and the data available. Always consult an expert to decide on the actions that need to or need not be taken when PD has been detected.
12.3 Reporting
12.3.1 Acoustic report templates
The Acoustic plug-in comes with several predefined acoustic reporting templates, e.g., Automatic acoustic, Discharge Analysis, and Leakage Analysis.
If these templates do not meet your requirements, you can create your own custom templates. For more information, see section 6.5 Create a reporting template .
12.3.2 Rapid report
You can easily create acoustic reports using shortcuts on your computer desktop. For more information, see section 6.3 Generate a report using Rapid Report .
12.3.3 Acoustic objects
You can add acoustic objects such as images, tables, plots, and fields to a report. For more information, see chapter 7 Edit reports .
